The old AREALME color blindness test asked you to read a number out of a field of colored dots, in the tradition of the Ishihara plates. The new one still looks like a plate of dots. What it asks, and what it gives back, are different.
You are shown a ring and asked where the gap is. At the end you get three scores, one for the cones that prefer red, one for green, and one for blue. A single “pass” or “fail” never described color vision very well. Most inherited color vision deficiency is a weakness along one direction, not a switch that turns color off.
What a plate asks you to do
The first plates are practice. The question is the same one the real plates use: where is the gap?
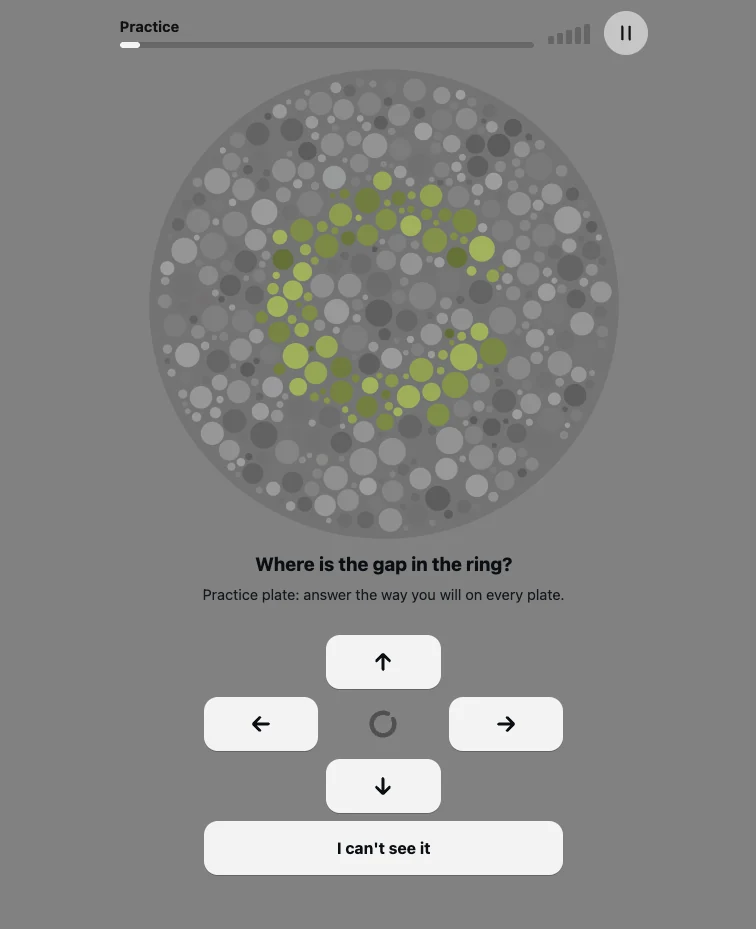
A practice plate. The gap in this ring points up. Later plates can hide a digit instead of a ring, and some of them are meant to be hard to see.
Four directions, or “I can’t see it.” Missing a plate is not a mistake you should avoid. The test keeps making the color difference smaller until it finds the point where the figure drops out. People with typical color vision miss plates too. That is how a limit gets measured.
The plates are drawn when you reach them, so there is no answer key to memorize. Dot sizes change from plate to plate. The shape does not sit in the same place twice.
The figure is only a color
A number that is also lighter than its background can be read without seeing the color at all. Printed plates have always fought that shortcut by mixing light and dark dots. Computer screens have a sharper version of the same problem: if the figure is a different brightness, or if it has a clean edge, the eye can trace the shape with no help from color.
The Cambridge Colour Test solved this by burying a Landolt ring in luminance noise. Figure and background use the same range of brightness. In grayscale the plate is a mess of dots. The only reliable cue is chromaticity, and that chromaticity moves along one confusion line: a set of colors that look alike when one cone type is weak or missing (Regan, Reffin & Mollon, 1994).
We generate plates the same way. Each one is aimed at a single channel:
- Red-sensitive cones, called L for long wavelength. A weak L channel is a protan, or red-weak, pattern.
- Green-sensitive cones, called M for medium wavelength. A weak M channel is a deutan, or green-weak, pattern, and it is the common one.
- Blue-sensitive cones, called S for short wavelength. A weak S channel is a tritan, or blue-yellow, pattern. Inherited tritan deficiency is rare. Blue-yellow changes also show up with age and with some eye conditions.
Because the three directions are separate, the test can report them separately. A person who confuses red and green is not, on that evidence alone, weak on blue.
What 100% means
The result is not an IQ-style grade. One hundred percent means your threshold on that channel matches a reference taken from published Cambridge Colour Test norms (Regan, Reffin & Mollon, 1994; Paramei, 2012). A higher percentage means a smaller color difference was enough. A lower percentage means the figure had to be more strongly colored before you could pick it out.
Those norms are a starting point. Screens are not calibrated laboratory monitors, and the reference will be revised as anonymous results come in. The percentage is a comparison with that reference, not a permanent medical scale.
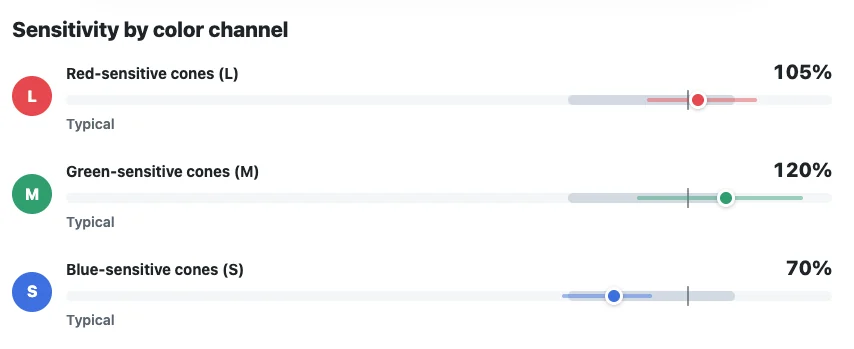
One sample result. Green sits a little above the reference, blue sits below it, and all three are still drawn against the band the current model calls typical.
Each score also has a range. Ten or so plates per channel is enough to locate a threshold, not enough to pretend the number is exact. The page says how settled the estimate is.
The pattern name sits on top of those three numbers: typical color vision, a mild or stronger red-weak or green-weak pattern, a blue-yellow pattern, a general loss, or an inconclusive result. When red and green are both elevated and the test cannot yet say which one is worse, it says so instead of guessing.
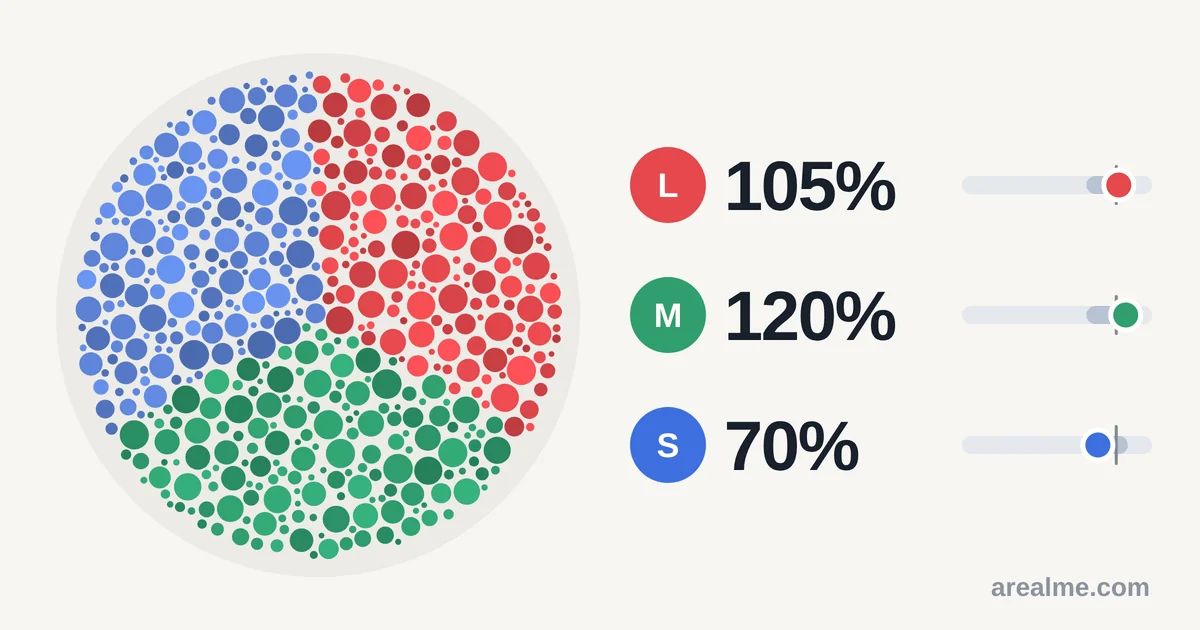
The share card carries the three scores and no words, so the same image works in every language.
If the pattern suggests a deficiency, the result page can recolor an illustration so you can show someone else a rough impression of the confusion. That picture uses a published simulation of cone loss (Machado, Oliveira & Fernandes, 2009). It is an illustration. The score comes from the plates you answered.
How the next plate is chosen
A fixed deck of plates wastes trials on figures you can already see, and it spends too few trials near the limit that actually matters. This test moves.
It starts easier than your limit and steps up until the first miss. After that, a short run of correct answers makes the next plate harder, and a short run of misses makes it easier. A meter on the screen shows which way it just moved. Once a channel is near its limit, the color strength of the next plate is chosen by a fixed-slope form of the Psi method (Kontsevich & Tyler, 1999): the difference expected to shrink the remaining uncertainty the most.
A few plates are not part of that hunt. They are bright, obvious figures. Almost anyone who can see the screen and follow the question should get them right. They catch a dim display, a heavy color filter, or answers tapped without looking. If those check plates fail, the result comes back inconclusive rather than as a deficiency.
Night Shift, True Tone, and blue-light filters change the colors the test is trying to measure. Turn them off. If a result surprises you, take it again on a second screen.
What the test will not tell you
This is a screening test. It is built to separate typical color vision from a red-green deficiency on a decent screen, and to say which channel is involved. It does not diagnose. An eye-care professional can confirm a finding with clinical plates, the HRR test, or an anomaloscope.
It also cannot see past the screen in front of you. A warm monitor, a dark room, and a phone with a color filter are three different tests. The number you get is your color vision on that display, compared with a provisional reference, with the uncertainty the answers support.
Color vision that changes suddenly, or that differs between the two eyes, needs a doctor. Inherited red-green deficiency is common, especially in men, and it is not an emergency. A new change is a different situation.
Try it
The color blindness test takes a few minutes. It starts with practice, adapts to your answers, and ends with a pattern, three channel scores, and the plates you missed.
Sources
- Regan, B. C., Reffin, J. P., & Mollon, J. D. (1994). Luminance noise and the rapid determination of discrimination ellipses in colour deficiency. Vision Research, 34(10), 1279-1299. https://doi.org/10.1016/0042-6989(94)90203-8
- Paramei, G. V. (2012). Color discrimination across four life decades assessed by the Cambridge Colour Test. Journal of the Optical Society of America A, 29(2), A290-A297. https://doi.org/10.1364/JOSAA.29.00A290
- Kontsevich, L. L., & Tyler, C. W. (1999). Bayesian adaptive estimation of psychometric slope and threshold. Vision Research, 39(16), 2729-2737. https://doi.org/10.1016/S0042-6989(98)00285-5
- Machado, G. M., Oliveira, M. M., & Fernandes, L. A. F. (2009). A physiologically-based model for simulation of color vision deficiency. IEEE Transactions on Visualization and Computer Graphics, 15(6), 1291-1298. https://doi.org/10.1109/TVCG.2009.113





Comments could not be loaded. Check your connection and try again.